-
GWSDAT includes the following tools for trend visualization and detection:
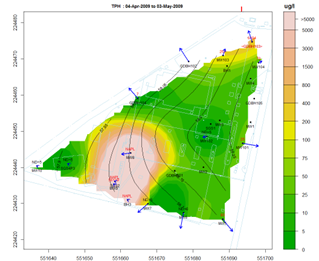
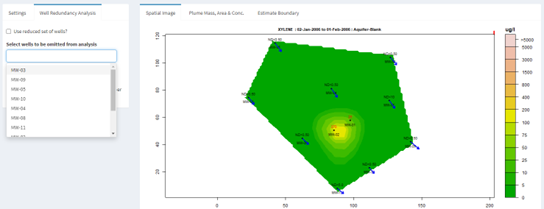
Spatial plot: For the analysis of spatial trends in solute concentrations, groundwater flow and, if present, NAPL thickness. Overlaid on this plot are the predictions of the spatiotemporal solute concentration smoother which is a function that simultaneously estimates both the spatial and time series trend in site solute concentrations. GIS shapefiles can also be overlaid on this plot.
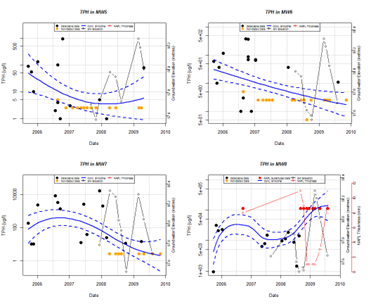
Well Trend plot: For the investigation of historical time-series trends in solute concentrations, groundwater elevation and, if present, NAPL thickness for individual wells. Users can overlay a nonparametric smoother which estimates the time-series trend in solute concentration. The advantage of this nonparametric method is that the trend estimate is not constrained to be monotonic, i.e. the trend can change direction.
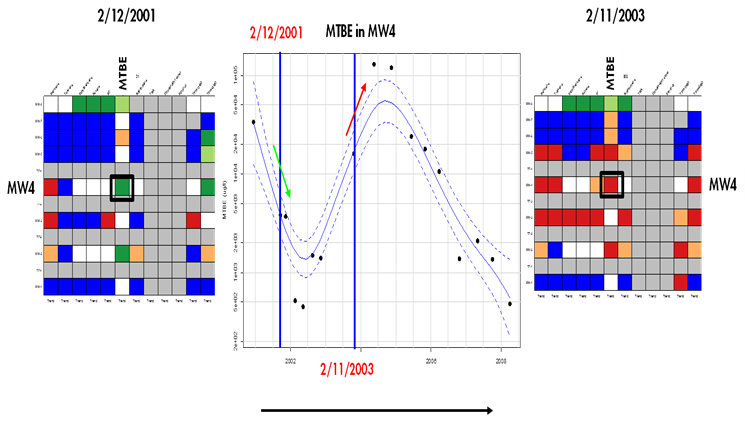
Trend and Threshold Indicator Matrix: This feature provides a summary of the level and time series trend in solute concentrations at a particular model output interval.
.
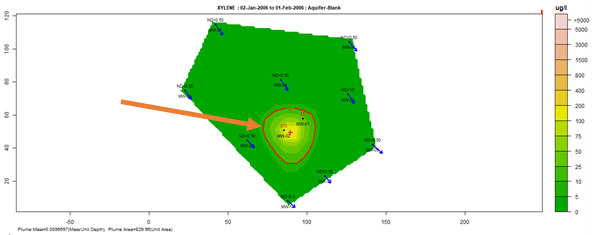
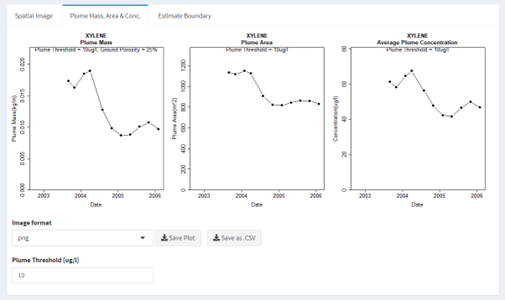
Plume diagnostics plots: This feature enables to calculate and display plume diagnostic quantities (area, mass, concentration) for a delineated plume displayed with a solid red contour line
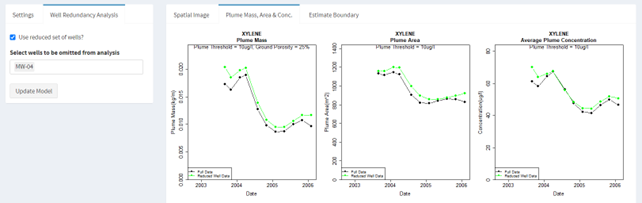
Well redundancy: This feature enables the user to very conveniently drop a well or a combination of wells from the analysis and investigate the resultant impact.
Well Influence Analysis: Building on the existing well redundancy analysis feature, GWSDAT now provides an ordered well omission list such that the wells estimated to have the least influence are presented first. This offers users more assistance in assessing which monitoring wells may be the most suitable for future omission and eventual decommissioning. This well influence order is established via a procedure fully documented here and here.